

Roof Replacement Cost by City
Local pricing guides for major US cities—understand what drives roofing quotes in your market before you compare bids.
Roofing Cost & Planning Tools
Whether it’s a pinpointed repair, surgical leak diagnosis, a full insurance-driven replacement, or proactive maintenance, we build every roof as a system—ventilation, underlayment, flashing, and proper fastening—so it performs for decades in Utah’s climate.
Are roofing calculators accurate?
They’re great for ballpark planning, but real pricing depends on layers, decking condition, ventilation, flashing complexity, and site access. Use the calculator, then get an inspection for a real quote.
What affects roof replacement cost the most?
Square footage, steepness, tear-off layers, material selection, and any required decking or ventilation upgrades typically drive the biggest swings.
What a new roof looks like
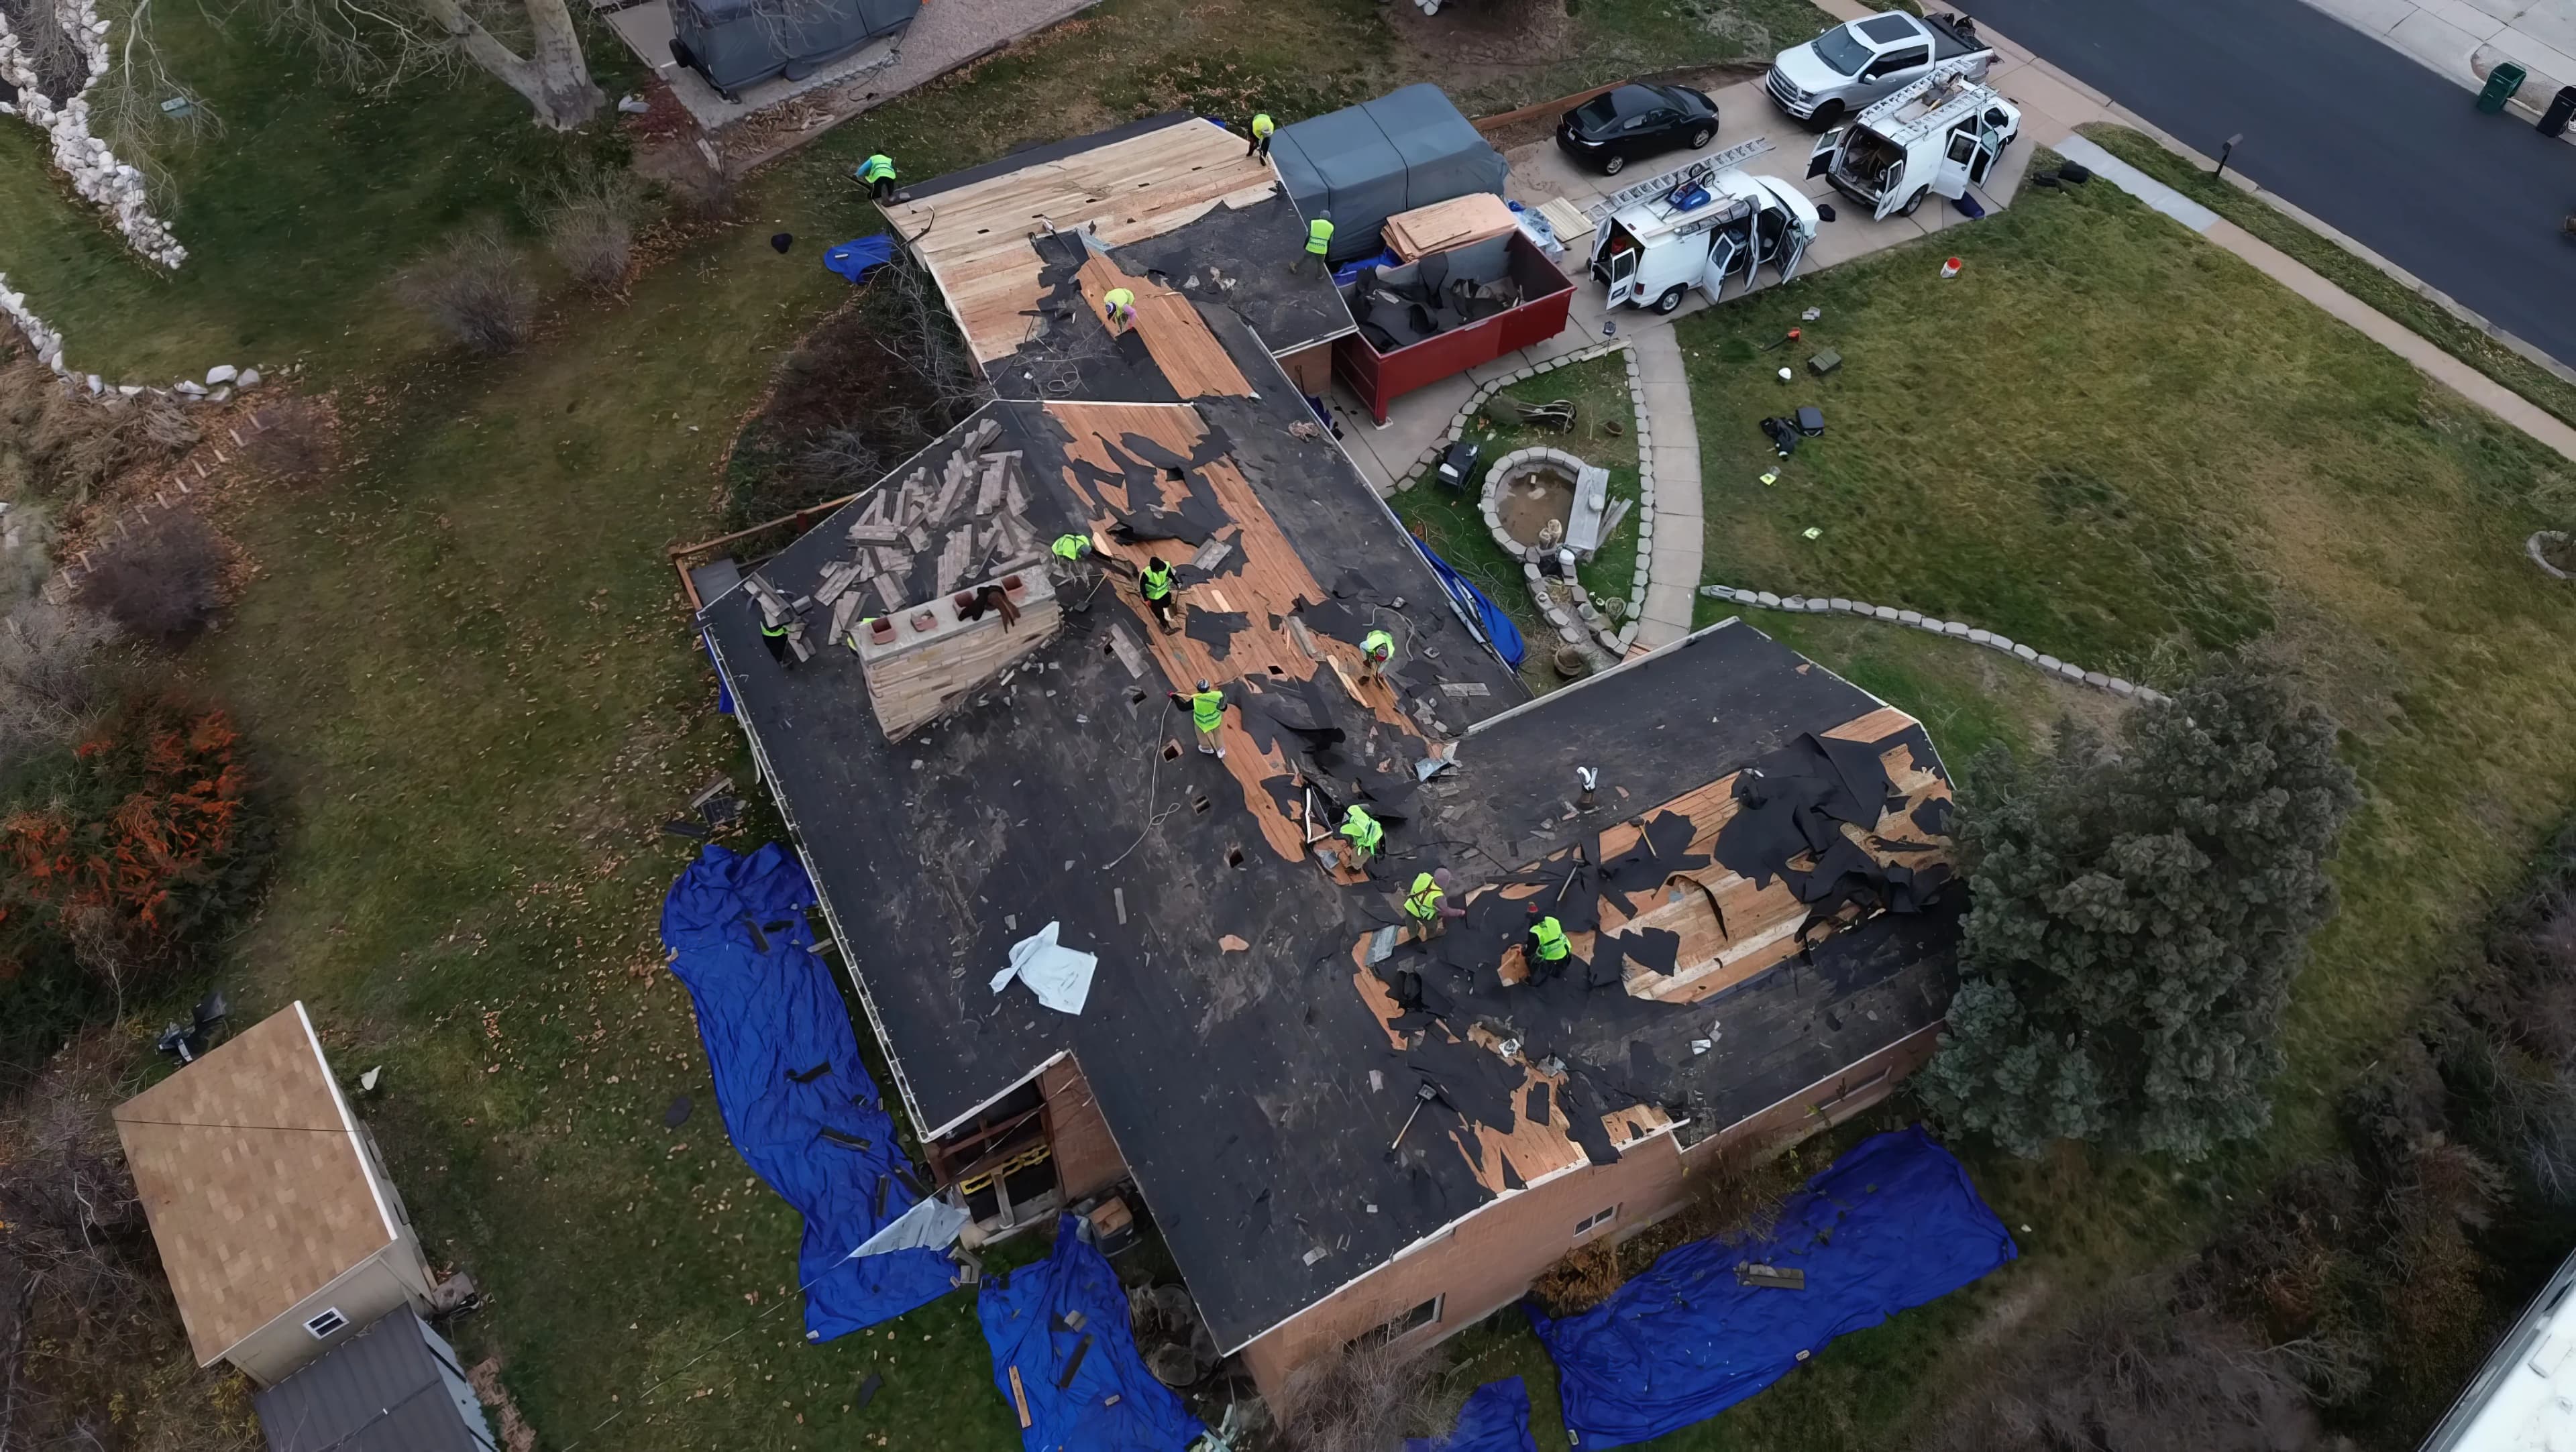
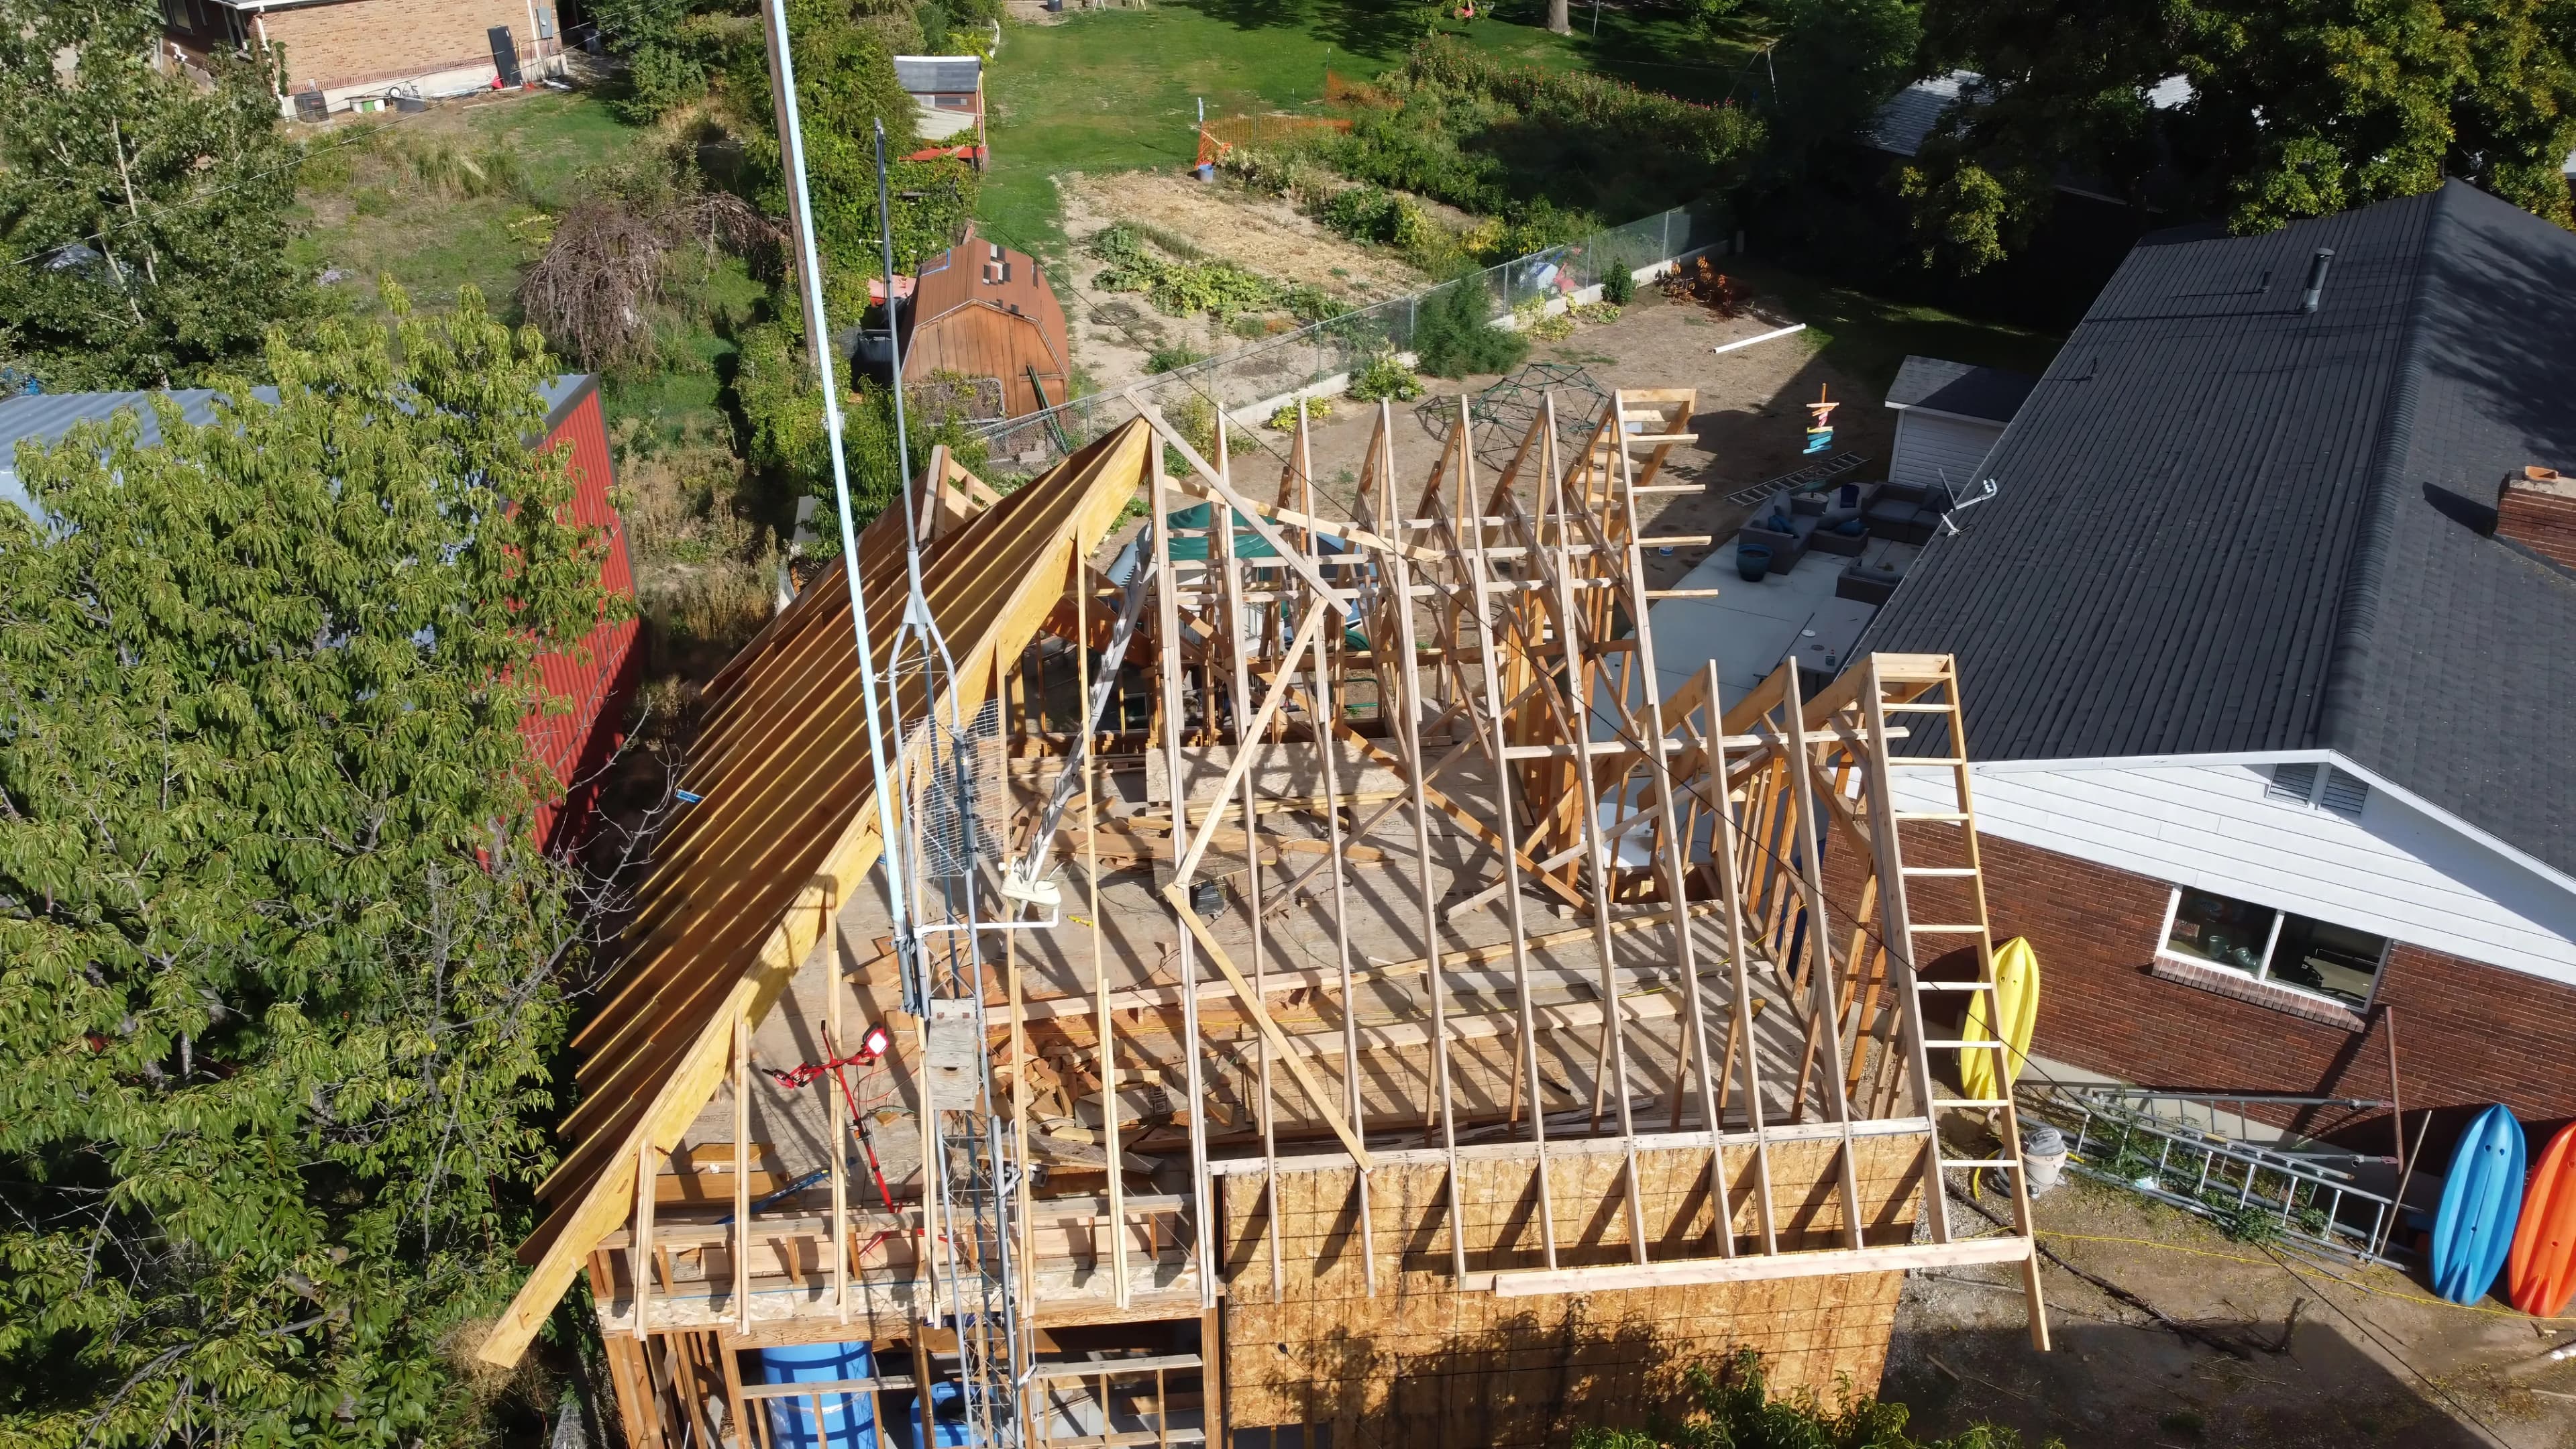
Real Utah replacement projects — the type of work behind these cost guides.
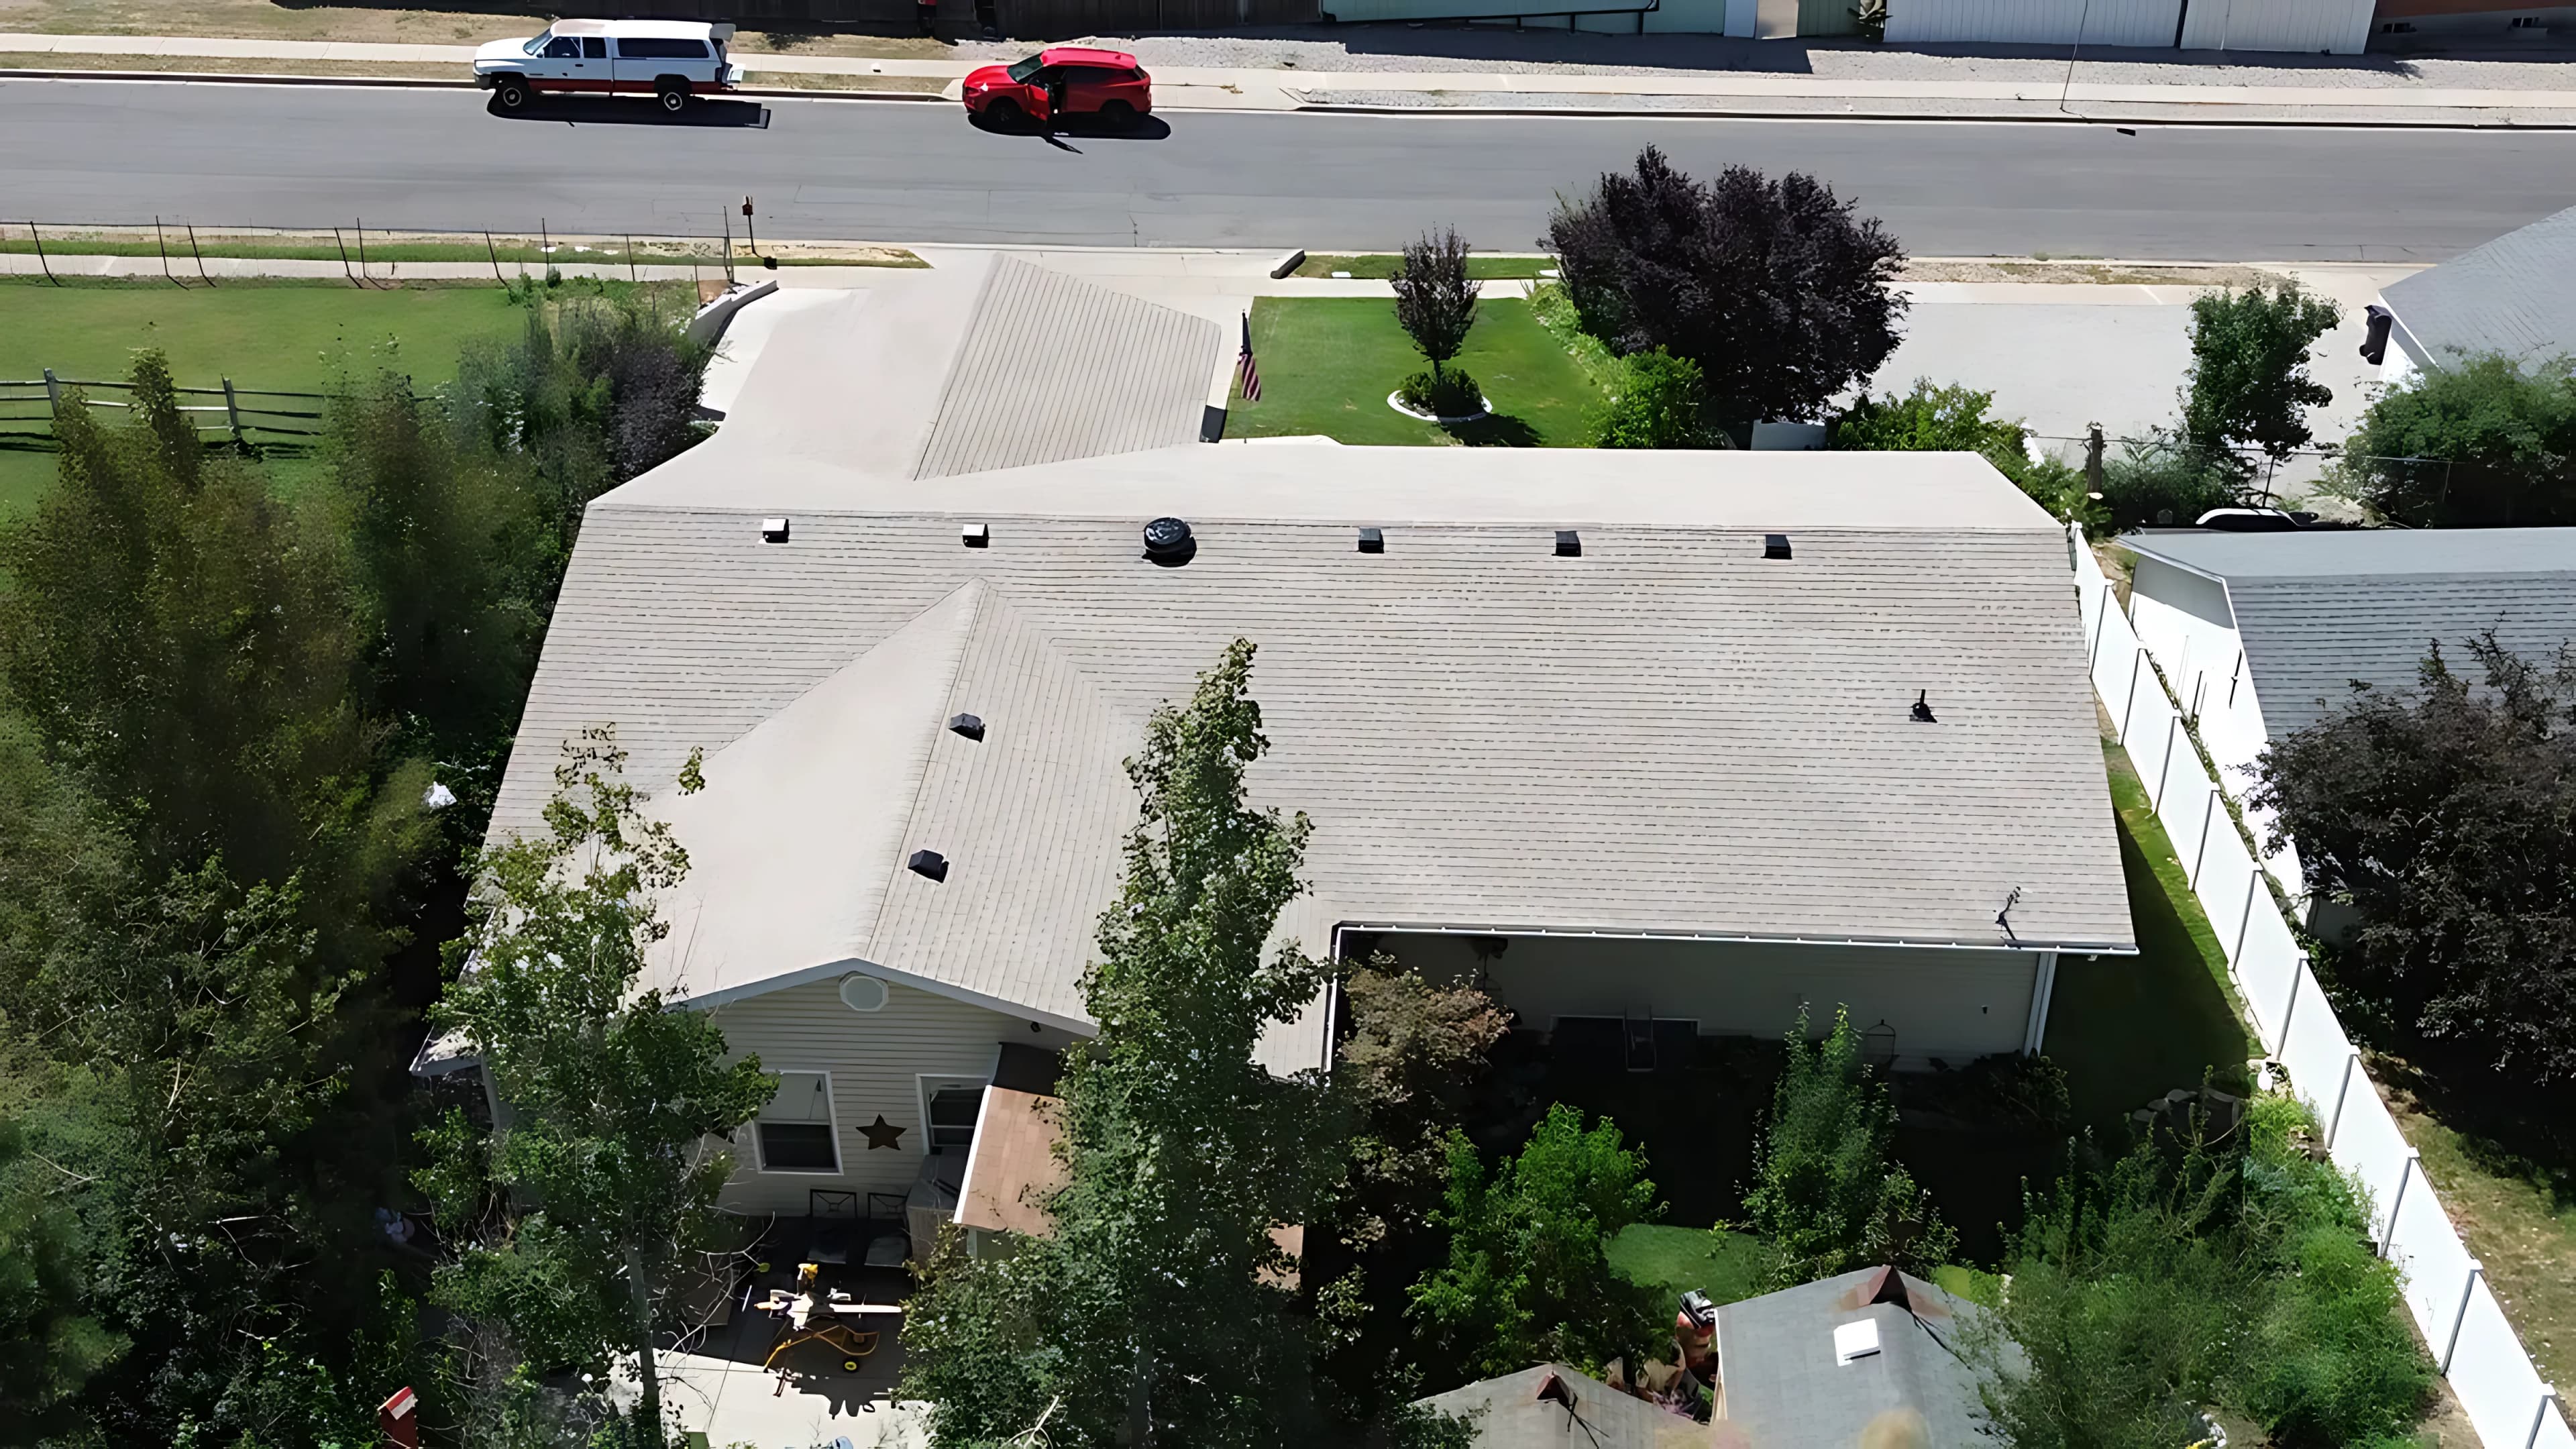
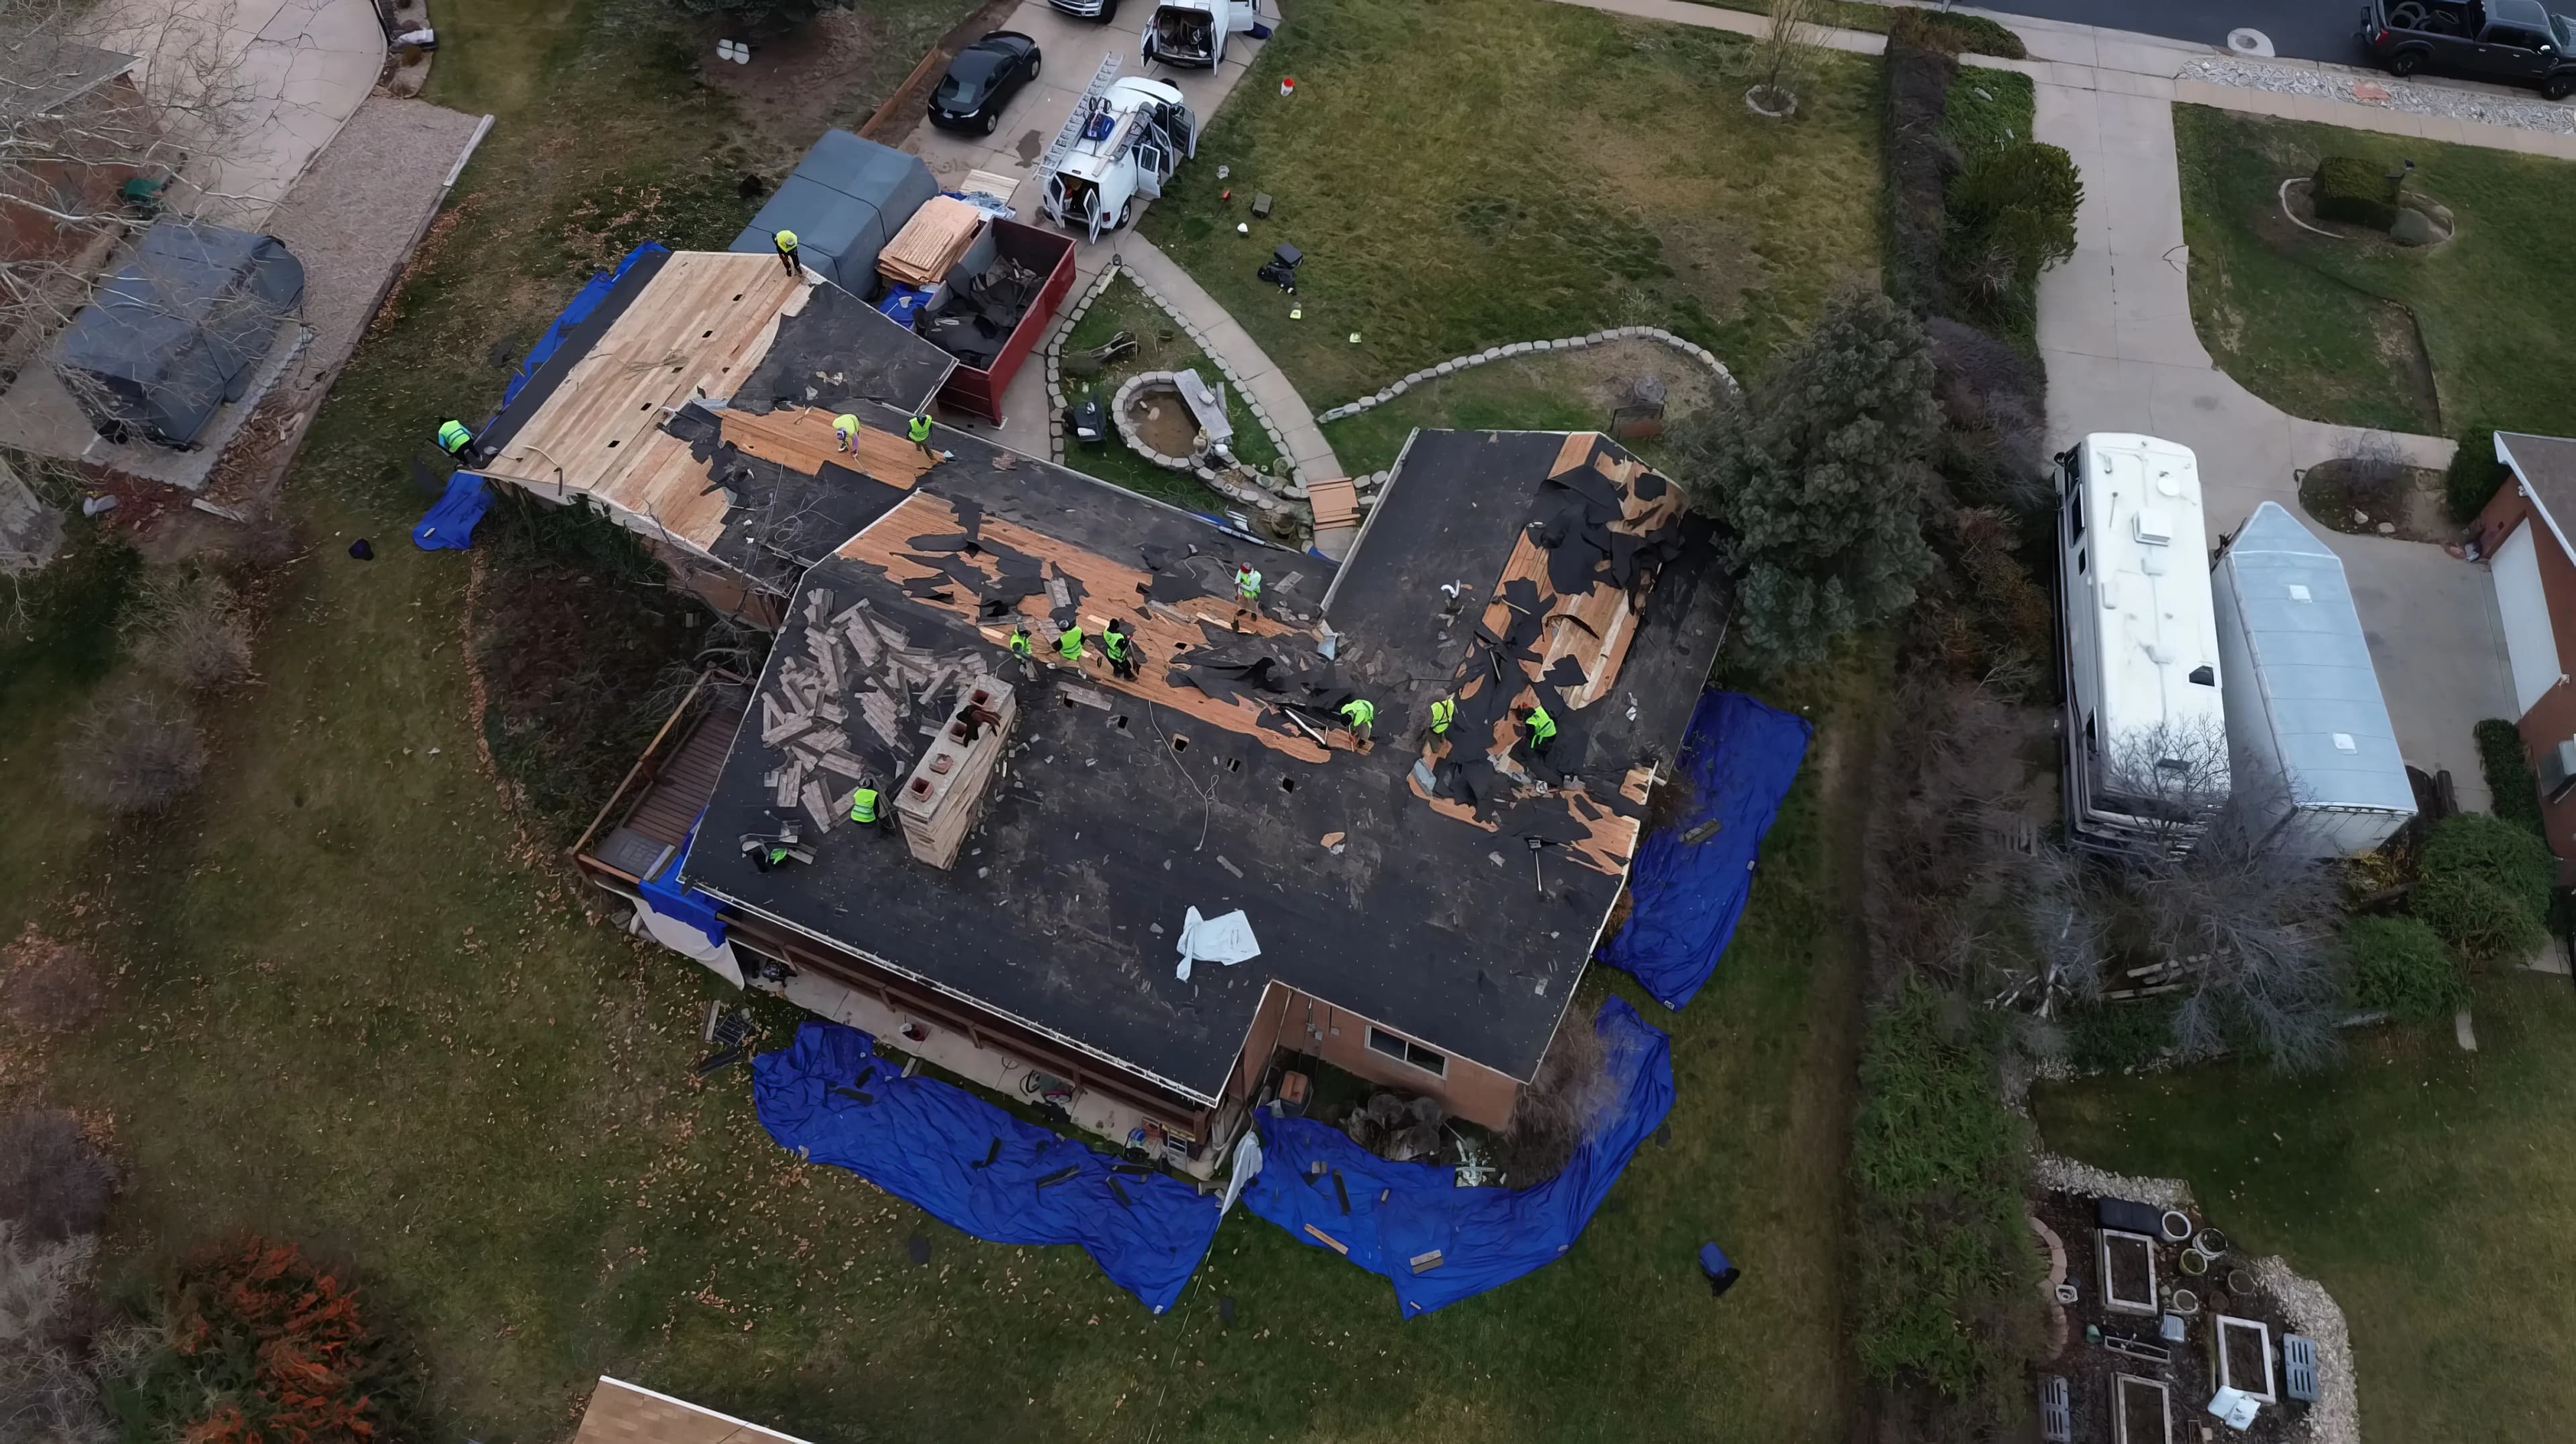
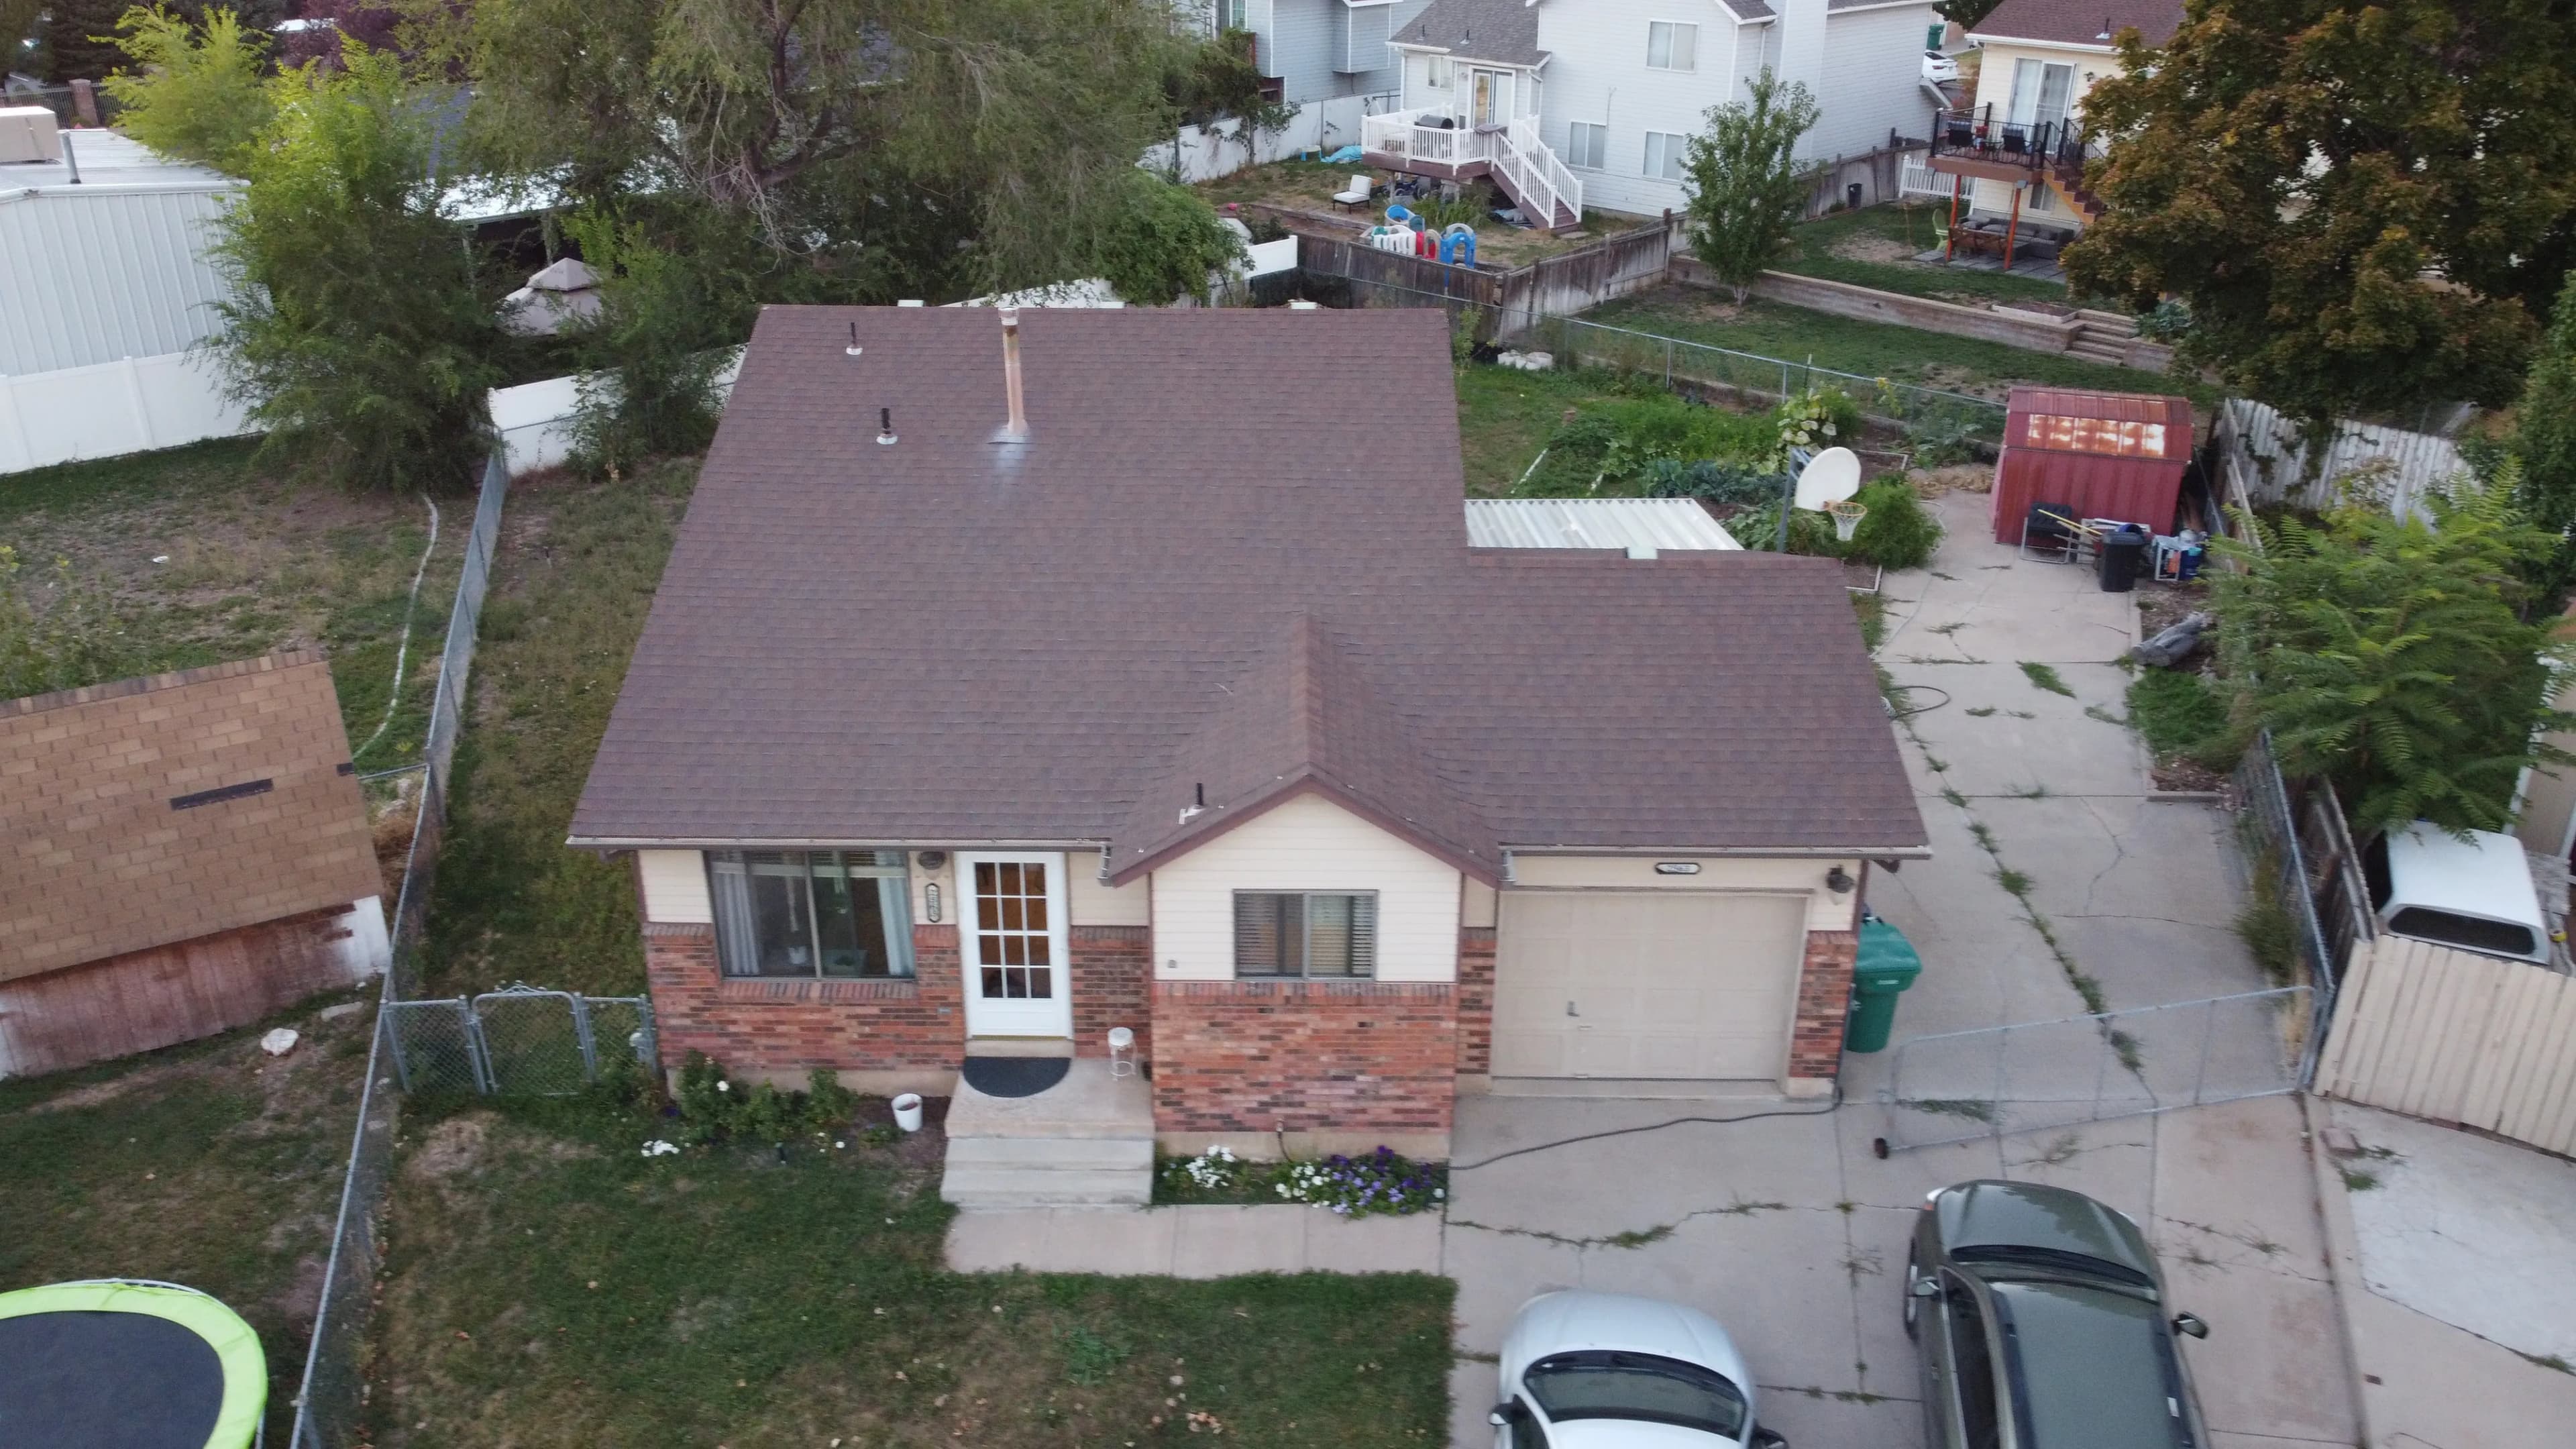
About these cost guides
Roofing costs vary significantly by city based on local labor markets, material availability, and climate-driven installation requirements. A roof replacement that costs $12,000 in a moderate-cost Midwest market may run $20,000+ in a high-cost coastal city for the same square footage and material tier.
Our city cost guides explain what drives local pricing and include climate context that affects material selection. For an accurate estimate on your specific roof, request a free inspection—online pricing guides are starting points, not quotes.
Local price index
Anonymized, cohort-based price data from qualifying local projects—published only once a minimum sample is reached.
Data collection state
No public price results yet
We have not published prices here because our private project dataset does not yet contain enough eligible, anonymized records to meet the minimum public cohort of 5. This page will not display synthetic or representative prices.
Use the existing cost guidesMethodology and limitations
- Price basis is the eligible contract-scope price, excluding records whose inclusion flags are incomplete or materially incomparable.
- Results use medians and 25th–75th percentile ranges; minimum cohort size is 5. Small cohorts are suppressed.
- Raw project records and stable source IDs are never published. The figures describe historical local projects, not a quote, estimate, appraisal, or prediction for an individual roof.
- Methodology version 1.0; generated 2026-08-06; data through not available.
How this resource works
Methodology
CostIndex figures are anonymized aggregates of qualifying roofing projects. Results use medians and percentile ranges to describe past work, not to predict an individual quote. Records are only published when a cohort reaches the minimum sample size, and raw project details or source IDs are never shared.


